
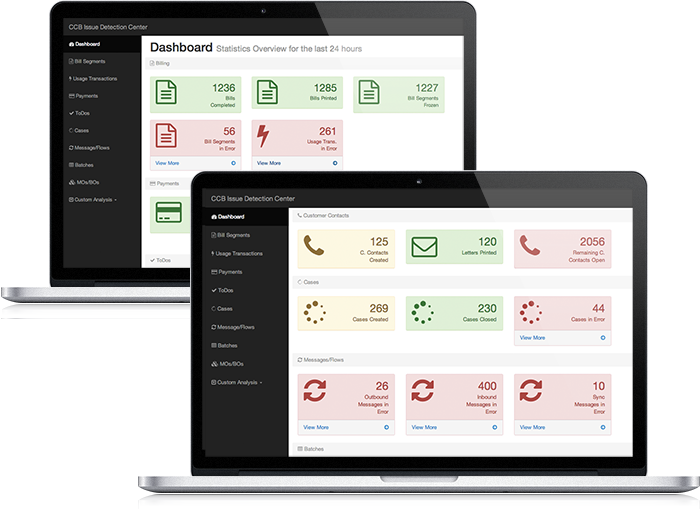
Dashboard provides key metrics in real-time
We believe that you should take no more than 60 seconds to understand how your system is performing.
Our dashboard provides a compelling summary of the most important processes and corresponding issues.
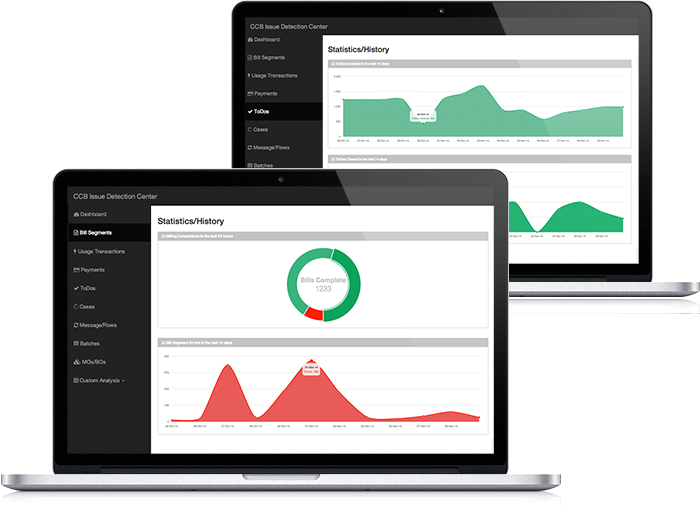
Charts allow you to visualize issue occurrences
Bill Segments Complete vs Bill Segments in Error?
How many Inbound Messages in error in the last month?
Our beautiful charts give you the answer to these and many other questions.
Lists give you the details about the existing issues
Ever wanted to list all the batches with errors and corresponding details? This feature allows you to do so!
Our tool provides many Issue Lists that will help you to quickly mitigate the existing issues.
